Management reports
Management reports that carry decisions.
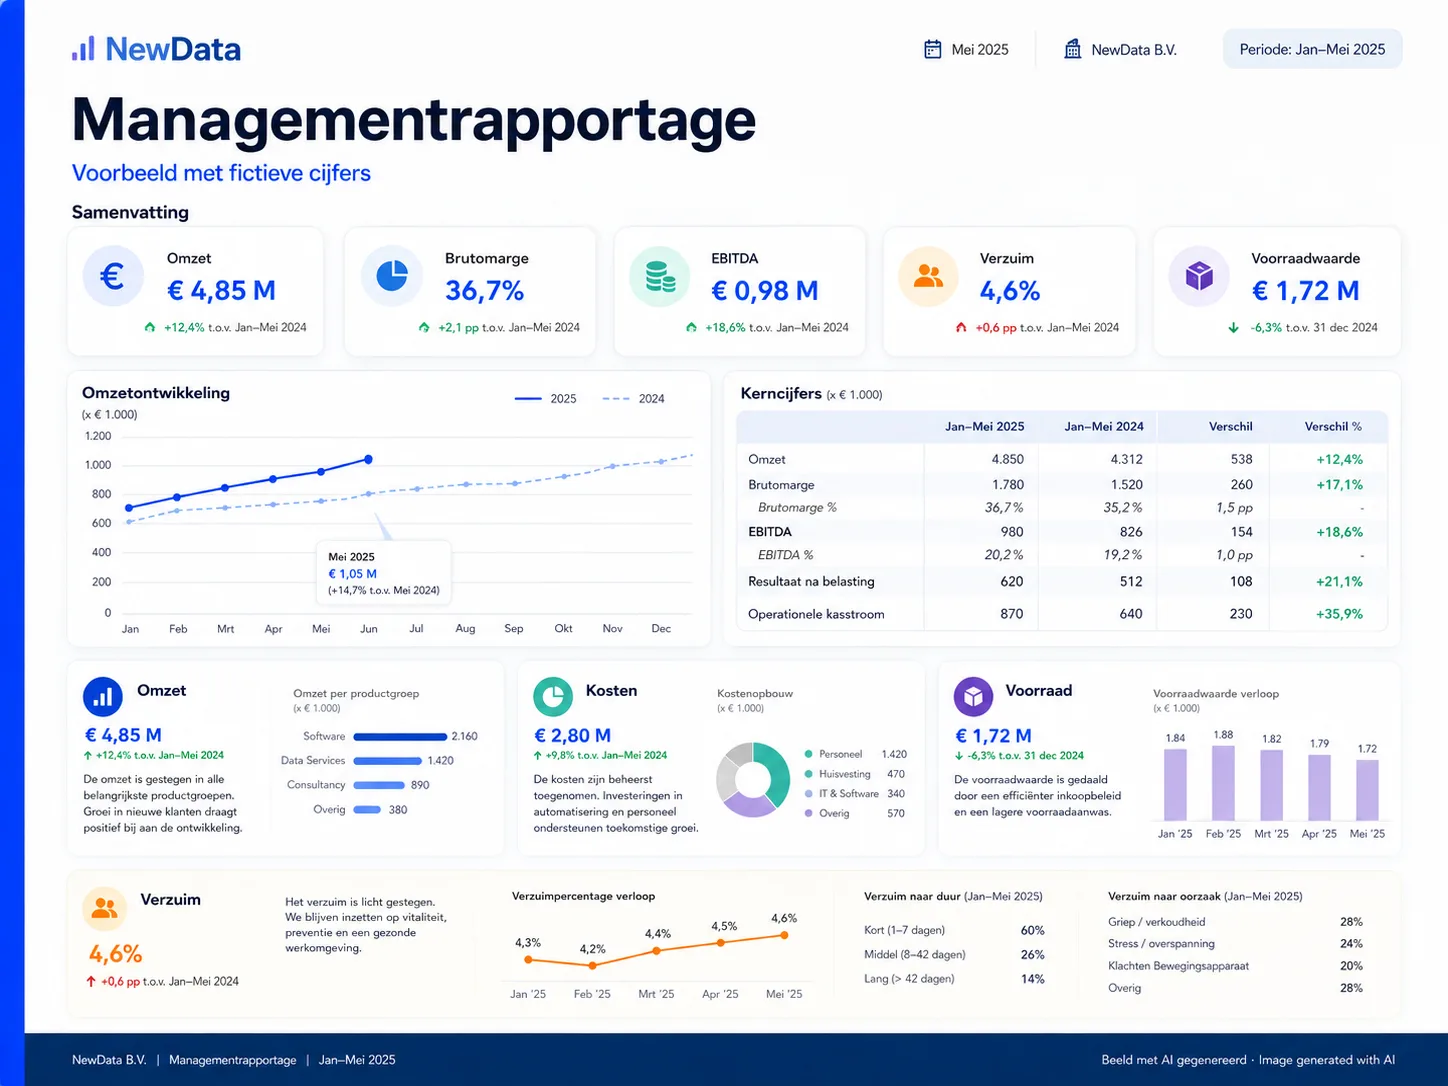
A management report shows how the organisation is doing every period: revenue, costs, stock or absence, taken from your own systems, in one document that board and management read together.
You get figures that come from the systems themselves instead of from scattered spreadsheets, with one definition per term, so two departments no longer bring different versions of the truth to the table.
A one-off build runs through NewData Squad, on quotation. To maintain the reports in-house afterwards, you hire a data analyst through NewData Student or recruit one permanently through NewData Search.
NewData

The problem
Do you recognise this?
Every month-end close costs the same week: exports from three systems, copy-and-paste work in spreadsheets and a report that is finished the moment nobody is waiting for it any more.
Two departments bring different revenue figures to the same meeting, and the meeting is about whose figure is right instead of about the decision.
The report leans on one colleague who knows how the pivot tables work; if that person leaves, the report stops.
And the question from the management team is usually simple, but the answer takes days. By the time it arrives, the meeting has already happened and the decision was made on gut feeling.
The solution
How do we solve this?
NewData does not start with the figures but with the decisions: which choices does the management team have to be able to make every period, and what has to be on the table for that. Only then come the sources and the definitions, and only then is anything built.
The supply is automated and one definition per term is fixed. The report comes from the systems themselves and is built the same way every period, so a difference between two periods is a real difference and not a counting effect.
Because gathering no longer takes time, room appears for the work that really matters: explaining what the figures mean and flagging what the management team did not ask for yet but does want to know.
What NewData builds at your organisation stays yours. Scripts, definitions and documentation come along, and NewData builds nothing that keeps you dependent, not even on NewData itself.
Related to this product: dashboards, a data platform.
Example
What it can look like
From our own work
Where did we do this before?
Wilco (co-founder NewData) did this himself: a series of automations turned the management reports into the push of a button, and insights became available that had never existed and that the management team had not expected to get.
At Groene Hart Ziekenhuis, NewData modelled patient-reported outcomes along the ICHOM method and translated them into a report and dashboards for the medical team.
The price
What does it cost?
If an experienced specialist builds the report as a one-off, you receive a quotation. If you hire a data analyst, the scale applies: from 70 euros per hour excluding VAT, going down to 60 euros for larger assignments (scale of August 2026). These are starting prices: your own remuneration scheme sets the wage, and the wage sets the rate. You choose the length of the assignment upfront and that sets the bracket. What it comes to at your organisation, we calculate for you before you sign anything.
Within two working days you receive a first response to your vacancy (lead time of August 2026).
The route
Which route fits?
One-off work runs through NewData Squad, on quotation (August 2026). Long-term work runs through NewData Student with the scale, or through NewData Search, from 650 euros per month excluding VAT (August 2026). NewData tells you up front which route fits your situation.
Read what each route means: NewData Squad for one-off work by experienced specialists, NewData Student for capacity and NewData Search for permanent recruitment.
This work is done by our data analysts. That page explains what the role does and when you deploy it.
Questions
Frequently asked question about this product
How do I turn scattered spreadsheets into one management report?+
By taking the figures from the systems themselves and agreeing one definition per term; after that the report is built the same way every period. That is the work of a data analyst. Through NewData you have such a report built as a one-off on quotation, or you hire a data analyst from 70 euros per hour excluding VAT, going down to 60 euros for larger assignments (scale of August 2026). These are starting prices: your own remuneration scheme sets the wage, and the wage sets the rate. You choose the length of the assignment upfront and that sets the bracket. What it comes to at your organisation, we calculate for you before you sign anything.
Next step
Curious what this could mean for your organisation?
Call 085 303 96 26 or email info@newdata.nl. Within two working days you receive a first response to your vacancy (lead time of August 2026).